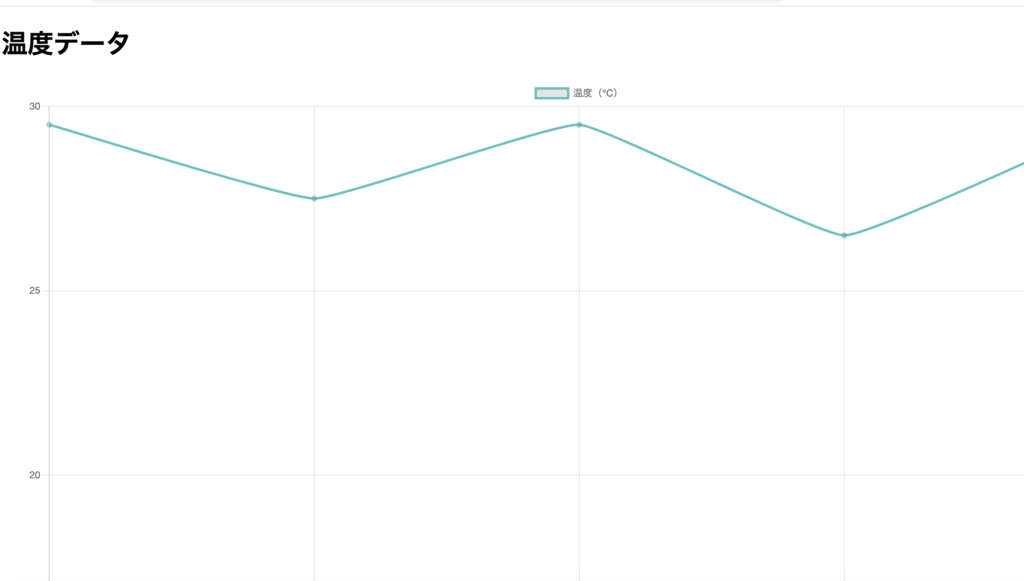
前回でようやくデータベースの情報をフロントエンドJavascriptを用いてブラウザに表示できました。
ここからはグラフの描画をしていきます。
・ようやくグラフ描画ができた
以下のコードにて、ようやくFirestoreデータベースのグラフの描画ができました。

・script.js
// For Firebase JS SDK v7.20.0 and later, measurementId is optional
const firebaseConfig = {
  const firebaseConfig = {
  apiKey: "xxx",
  authDomain: "xxx.firebaseapp.com",
  projectId: "xxx",
  storageBucket: "xxx.appspot.com",
  messagingSenderId: "xxx",
  appId: "xxx",
    };

    // Firebase、Firestoreを初期化
    firebase.initializeApp(firebaseConfig);
    const db = firebase.firestore();

    // グラフを描画する関数
    function drawChart(temperatureData) {
      const ctx = document.getElementById('myLineChart').getContext('2d');
      const myLineChart = new Chart(ctx, {
        type: 'line',
        data: {
          labels: temperatureData.map(data => data.timestamp),
          datasets: [{
            label: '温度(℃)',
            data: temperatureData.map(data => data.temperature),
            fill: false,
            borderColor: 'rgb(75, 192, 192)',
            tension: 0.1
          }]
        },
        options: {
          scales: {
            y: {
              beginAtZero: true
            }
          }
        }
      });
    }


    // Firestoreのタイムスタンプを指定タイムゾーンの時刻にフォーマットする関数
    function formatTimestampInTimeZone(timestamp, timeZone) {
      const date = new Date(timestamp.seconds * 1000);  // FirestoreのTimestampをDateオブジェクトに変換
      const formatter = new Intl.DateTimeFormat('ja-JP', {
        timeZone: timeZone,
        year: 'numeric',
        month: '2-digit',
        day: '2-digit',
        hour: '2-digit',
        minute: '2-digit',
        second: '2-digit'
      });
      return formatter.format(date);
    }

    // temperatureDataコレクションからデータを取得してグラフに表示
    // orderBy('timestamp')でデータを古い順に並べ替え
    const temperatureDataRef = db.collection('temperatureData').orderBy('timestamp');
    temperatureDataRef.get().then((querySnapshot) => {
      const temperatureData = [];
      querySnapshot.forEach((doc) => {
        const data = doc.data();
        // temperatureDataに値をセット
        temperatureData.push({
          temperature: data.temperature,
          timestamp: formatTimestampInTimeZone(data.timestamp, "Asia/Tokyo")
        });
      });

      // グラフ描画のためのデータ準備
      drawChart(temperatureData);
    }).catch(error => {
      console.error("Error getting documents: ", error);
    });
・index.html
<!DOCTYPE html>
<html>
<head>
<title>Temperature Data</title>
<!-- Firebaseの設定 -->
<script src="https://www.gstatic.com/firebasejs/9.0.0/firebase-app-compat.js"></script>
<script src="https://www.gstatic.com/firebasejs/9.0.0/firebase-firestore-compat.js"></script>
<!-- グラフ描画のためのライブラリ追加(例: Chart.js) -->
<script src="https://cdn.jsdelivr.net/npm/chart.js"></script>


</head>
<body>
<h1>温度データ</h1>
<canvas id="myLineChart" width="400" height="400"></canvas> <!-- グラフを表示するための要素を <canvas> に変更 -->
<script src="backup2.js"></script>
</body>
</html>
ここからはグラフの表示の修正やデータごとの複数のグラフの描画について実施していきます。
最終的に作成したコード
最終的に作成したコードは以下になります。
・index.html
<!DOCTYPE html>
<html>
    <head>
        <title>Temperature Data</title>
        <!-- Firebaseの設定 -->
        <script src="https://www.gstatic.com/firebasejs/9.0.0/firebase-app-compat.js"></script>
        <script src="https://www.gstatic.com/firebasejs/9.0.0/firebase-firestore-compat.js"></script>
        <!-- グラフ描画のためのライブラリ -->
        <script src="https://cdn.jsdelivr.net/npm/chart.js"></script>
        <script src="https://cdn.jsdelivr.net/npm/chartjs-plugin-annotation@1.0.2"></script>
        <link rel="stylesheet" href="style.css">
      </head>

<body>
    <h1>温度データ</h1>
    <h2>高温障害:<span id="borderTemperatureValue"></span>℃</h2>
    <!-- bodyに直接グラフ・表を書き込み -->
    <script src="config.js"></script>
    <script src="chartFunctions.js"></script>
    <script src="tableFunctions.js"></script>
    <script src="timestampFunctions.js"></script>
    <script src="dataRetrieval.js"></script>
</body>
</html>
・config.js
// 初期設定
// APIキー
const firebaseConfig = {
      apiKey: "xxx",
      authDomain: "xxx",
      projectId: "xxx",
      storageBucket: "xxx",
      messagingSenderId: "xxx",
      appId: "xxx",
    };

    // Firebase、Firestoreを初期化
    firebase.initializeApp(firebaseConfig);
    const db = firebase.firestore();


// ボーダーラインの温度
const border_temperature = 35

// DOMが完全に読み込まれた後に実行
document.addEventListener('DOMContentLoaded', (event) => {
  document.getElementById('borderTemperatureValue').textContent = border_temperature;
});


// Macアドレスと対応する機械の名前
const machineNames = {
  "aaaaaa":"Aハウス 1号機",
  "bbbbbb":"Bハウス 1号機"
};

// 機械の名前を呼び出す関数
function getMachineName(key) {
  return machineNames[key] || 'キーが見つかりません';
}
・chartFunctions.js
// グラフを描画する関数
// 追加された引数 macAddress を使用して、各macAddressに対応するグラフを描画
function drawChart(temperatureData, macAddress) {

  // 動的にCanvas要素を生成
  const canvasId = `chart-${macAddress}`;
  const canvasHtml = document.createElement('div');
  // 端末の名前を取得
  const machineName = getMachineName(macAddress);
  canvasHtml.innerHTML = `<h2>${machineName} の温度グラフ</h2><canvas id="${canvasId}" width="400" height="400"></canvas>`;
  // bodyに直接追加
  document.body.appendChild(canvasHtml);

  // グラフ描画関数を呼び出す
  drawLineChart(canvasId, temperatureData, macAddress);
}

function drawLineChart(canvasId, temperatureData, macAddress) {
  // 温度データから最小値と最大値を計算
  const temperatures = temperatureData.map(data =>; data.temperature);
  const minTemperature = Math.min(...temperatures);
  const maxTemperature = Math.max(...temperatures);
  console.log("minTemperature :",minTemperature)
  console.log("maxTemperature :",maxTemperature)
  console.log("drawChart macAddress :",macAddress);

  const ctx = document.getElementById(canvasId).getContext('2d');
  // 以降のグラフ描画のコードはそのまま


  const myLineChart = new Chart(ctx, {
    type: 'line',
    data: {
      labels: temperatureData.map(data => data.timestamp),
      datasets: [{
        label: `${macAddress} の温度(℃)`, //後の display: false で凡例を非表示に設定
        data: temperatureData.map(data => data.temperature),
        fill: false,
        borderColor: 'rgb(75, 192, 192)',
        tension: 0.1
      }]
    },
    options: {
      scales: {
        y: {
          // beginAtZero: true,
          ticks: {
            // 最小値と最大値をY軸の範囲として設定
            min: minTemperature,
            max: maxTemperature,
            // Y軸の刻み間隔を1単位に設定
            stepSize: 1,
            font: {
              // Y軸のラベルのフォントサイズ
              size: 40
            }
          }
        },
        x: {
          ticks: {
            // X軸の刻み間隔を1単位に設定
            stepSize: 1,
            // ラベルを水平に保つ
            minRotation: 0,
            maxRotation: 0,
            font: {
              // X軸のラベルのフォントサイズ
              size: 10
            },
            callback: function(value, index) {
              // このコールバック関数内でthisを使用してグラフのデータにアクセス
              const label = this.chart.data.labels[index];
              // console.log("Label:", label);
              // 改行を含む文字列を分割して、2行に分ける
              const parts = label.split('\n');
              return parts; // 2行の配列を返す
            }
          }
        }
      },
      plugins: {
        legend: {
          display: false // 凡例を非表示に設定
        },
        annotation: {
          annotations: {
            line1: {
              type: 'line',
              yMin: border_temperature,
              yMax: border_temperature,
              borderColor: 'red',
              borderWidth: 3,
              label: {
                content: `${macAddress} - 高温障害: ${border_temperature}℃`,
                enabled: false, // テキストを非表示
                position: 'start',
                font: {
                  size: 30, // フォントサイズを16pxに設定(適宜変更可能)
                },
                color: '#000', // テキストの色を設定
                padding: 1 // テキストの周囲の余白を設定
              }
            }
          }
        }
      }
    }
  });
}
・tableFunctions.js
// テーブルを表示する関数
function drawTable(data, macAddress) {
  console.log("drawTable macAddress :", macAddress);

  // 新しいdiv要素を作成
  const tableDiv = document.createElement('div');
  tableDiv.className = 'table-container'; // オプションでクラス名を追加

  // 端末の名前を取得
  const machineName = getMachineName(macAddress);

  // テーブルとヘッダーを作成
  let table = `<h2>${machineName}の温度表</h2>`;
  table += `<table border='1'><tr><th>日時</th><th>温度</th></tr>`;

  // データを行に追加
  data.forEach(item => {
    // 温度が35度以上の場合は赤色で太字強調表示
    let temperatureStyle;
    if (item.temperature >= border_temperature) {
        temperatureStyle = 'style="color: red; font-weight: bold;"';
    } else {
        temperatureStyle = '';
    }
    table += `<tr><td>${item.timestamp}</td><td ${temperatureStyle}>${item.temperature}</td></tr>`;
  });

  table += `</table><br><br><br><br>`;
  tableDiv.innerHTML = table; // tableDivの中にテーブルを設定

  document.body.appendChild(tableDiv);
}
・timestampFunctions.js
// タイムスタンプ関数
// Firestoreのタイムスタンプを指定タイムゾーンの時刻にフォーマットする関数
function formatTimestampInTimeZone(timestamp, timeZone) {
      const date = new Date(timestamp.seconds * 1000);

      // 日付(月/日)のフォーマット
      const dateFormatter = new Intl.DateTimeFormat('ja-JP', {
        timeZone: timeZone,
        month: '2-digit',
        day: '2-digit'
      });

      // 時間(時:分)のフォーマット
      const timeFormatter = new Intl.DateTimeFormat('ja-JP', {
        timeZone: timeZone,
        hour: '2-digit',
        minute: '2-digit'
      });

      // 日付と時間を組み合わせて2行の文字列を生成
      const formattedDate = dateFormatter.format(date); // 例: '11/28'
      const formattedTime = timeFormatter.format(date); // 例: '11:50'
      // 日付と時間を改行で結合
      const retuernTime = formattedDate + '\n' + formattedTime; // '11/28\n11:50'

      // 日付と時間を改行で結合
      return retuernTime
    }
・dataRetrieval.js
// コレクションからデータを取得してグラフに表示
// orderBy('timestamp')でデータを古い順に並べ替え
const temperatureDataRef = db.collection('xxx').orderBy('timestamp');

// Firebaseからデータを取得し処理
temperatureDataRef.get().then((querySnapshot) => {
  const groupedData = {};

  querySnapshot.forEach((doc) => {
    const data = doc.data();
    const macAddress = data.macAddress;
    // console.log("data",data)

    // macAddressがまだgroupedDataになければ、新しい配列を作成
    if (!groupedData[macAddress]) {
      groupedData[macAddress] = [];
    }

    // macAddressに対応する配列にデータを追加
    groupedData[macAddress].push({
      temperature: data.temperature,
      timestamp: formatTimestampInTimeZone(data.timestamp, "Asia/Tokyo")
    });
  });

  // 各macAddressごとにグラフとテーブルを描画
  Object.keys(groupedData).forEach(macAddress => {

    console.log("groupedData",groupedData)

    // グラフの描画
    drawChart(groupedData[macAddress], macAddress);

    // テーブルの描画
    drawTable(groupedData[macAddress], macAddress);
  });

}).catch(error => {
  console.error("Error getting documents: ", error);
});
ポイント、つまづいた点
・グラフ描画について1つのデータセットでグラフ描画&テーブル表示、としたいが、全部のデータセットでテーブル表示して、そのあとグラフ描画されてしまう
最初htmlにdivクラスを設定し、そこにテーブル表示させており、グラフ描画はdivクラス設定なしでbodyに直接追記する形をとっていました。
そのためまとめてテーブル表示された後でグラフ描画され、意図する動作ができていませんでした。
・動的にCanvas要素を生成し描画
温度測定する端末を増やすごとに表示する箇所を増やすのは面倒なので動的に描画することにしました。
・グラフの上限と下限を動的に変更
0℃からグラフを始めるとY軸の数値が多すぎるのでminTemperature,maxTemperatureの箇所で最大、最小を求めてグラフのY軸の範囲を狭くしました。
・グラフにアノテーションを追加
高温障害になる35℃を基準にグラフに赤い横線を追加しました。
・グラフのX軸のラベルを日付と時刻の2行にした
ブラウザで温度データが表示されない(無効な日付または時間の値)
ブラウザでCloud Run URLを開いたとき、温度データが表示されないことがありました。
ブラウザのログ:
Failed to load resource: the server responded with a status of 404 ()
dataRetrieval.js:40 Error getting documents: RangeError: Invalid time value
at formatTimestampInTimeZone (timestampFunctions.js:21:43)
at dataRetrieval.js:23:18
at database.ts:1253:16
at snapshot.ts:437:16
at document_set.ts:97:7
at no.inorderTraversal (sorted_map.ts:324:7)
at no.inorderTraversal (sorted_map.ts:325:38)
at no.inorderTraversal (sorted_map.ts:323:37)
at no.inorderTraversal (sorted_map.ts:325:38)
at no.inorderTraversal (sorted_map.ts:325:38)
これは、データベースに保存している日時が誤っていて、XXXX年XX月XX日XX:XX:XX UTC+9となるところ、別の形式で保存され、そのため読み込みができずエラーになり表示されませんでした。
これはデータの形式を統一、修正することで解決しました。

